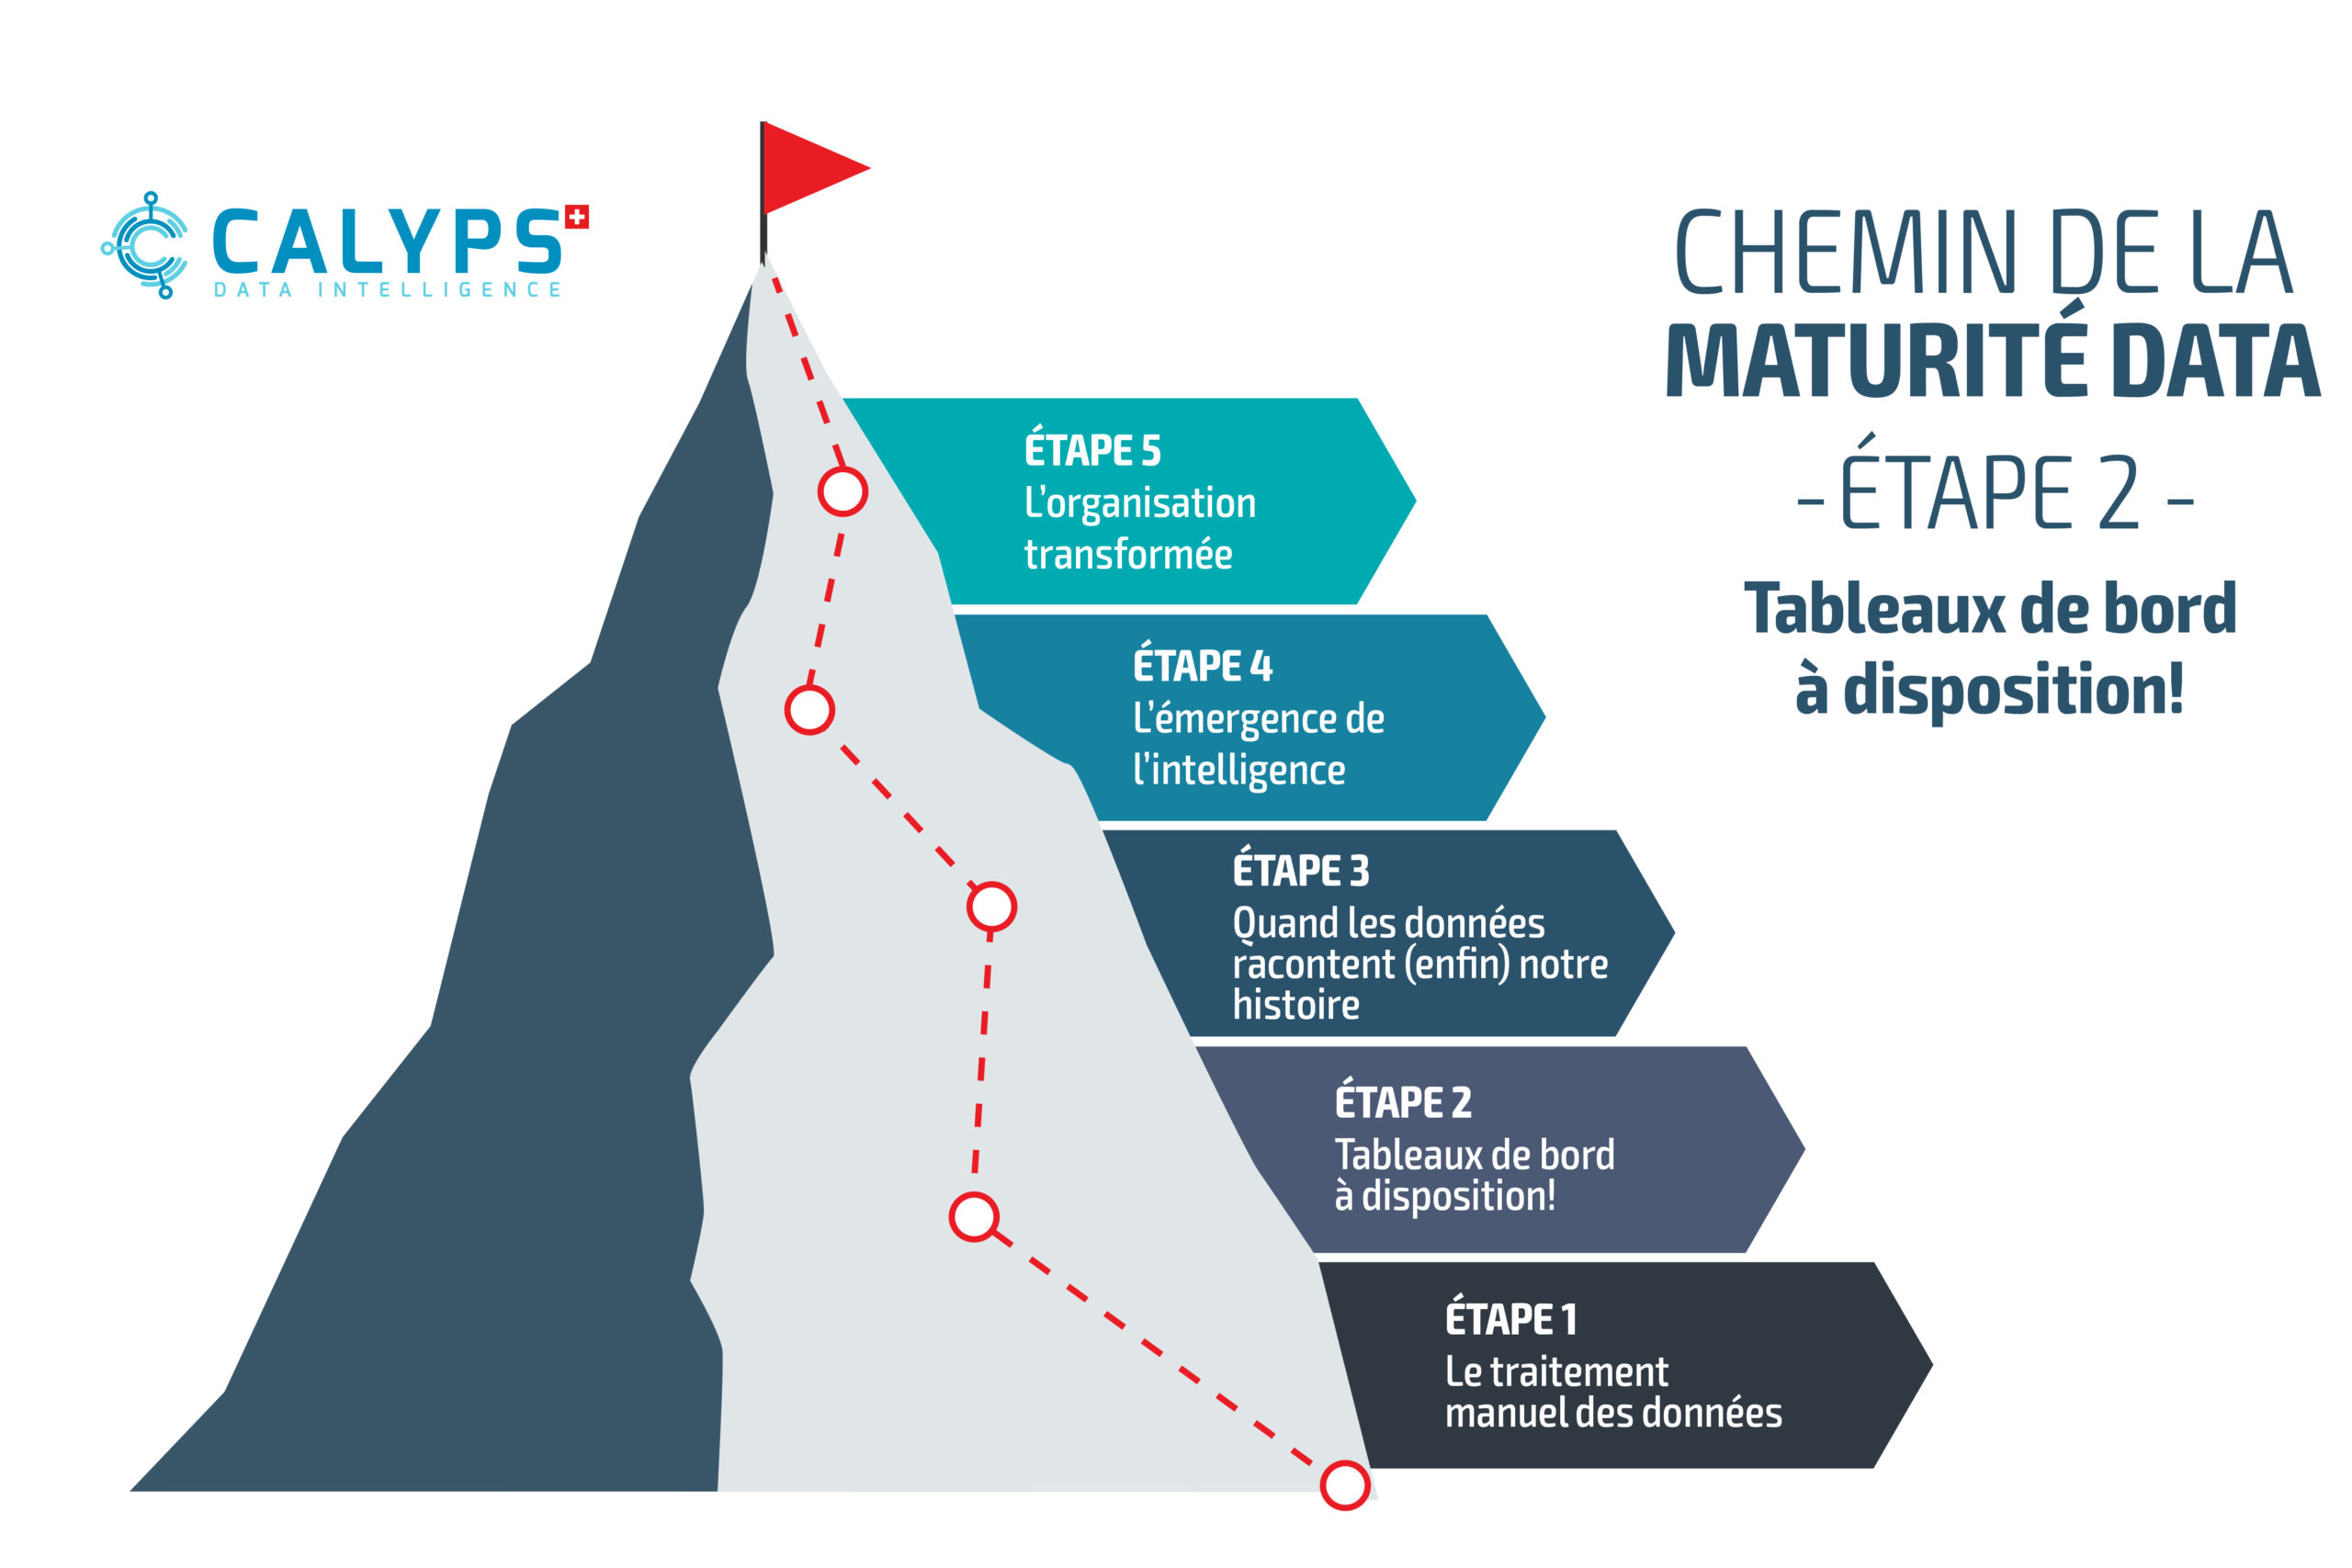
Click here to watch the webinar Step 2: From Spreadsheet to Dashboard.
Manual data processing (see our article on step 1 of the Data Maturity Path) and dashboards sold as self-service BI hide one of the main problems at this stage of data maturity: multiple and sometimes inconsistent sources of truth.
The same answers are found in multiple information systems – the CRM and a separate solution for generating customer quotes, for example – operating without data interoperability. While employees search for answers in different parts of the organization, copies of files are scattered as they are analyzed. Finance, sales, marketing, production planning, logistics, or customer service: with the increasing importance of data, every professional must now reinvent themselves as an analyst to understand what is happening within their scope of activities.
Often, the challenge of data sharing is addressed by flooding each colleague in the loop with… even more data. In this respect, Business Intelligence (BI) can become a misused tool, contradicting the company’s policy despite good intentions. Regardless of the department, the temptation can be great to think to oneself:
“If we could load these data into a BI solution that the team could manipulate at will, it would be better for everyone!”
Let’s be clear: this is definitely not the case.
From Self-Service BI to Shadow IT
The desire to better understand one’s sphere of activities can lead to the creation of “parallel IT teams”, or shadow IT, e.g., business teams creating their own tool – starting with the good old Excel macro – to process data according to their specific needs. Self-service BI and tools like Qlik Sense or Power BI have given rise to sometimes illegitimate data dashboards, created without the approval of the IT department.
For its proponents, shadow IT is seen as a source of innovation, with such initiatives sometimes serving as prototypes for future official solutions. For its detractors, it represents a risk for the entire organization, as these solutions are created in disregard of information governance and good practices in documentation and security.
From Dashboard to Decision Support Tool
Originally designed to provide a simplified view of what is happening within the company, these dashboards can quickly resemble the cockpit of a space shuttle with dozens of dials, displays, and key performance indicators. A good dashboard relies on data literacy and allows for identifying, collecting, processing, analyzing, and interpreting data according to guidelines recognized by experts. In the end, a lot of time (and money) can be lost designing a BI solution, not to mention the hours spent navigating screens to try to get answers!
To summarize: • Beyond access to information, the real challenge to overcome for professional organizations wishing to progress on the path of data maturity is the multiple sources of information. • Self-service BI can provide answers to business teams, but is not a panacea: any data solution must be governed by the organization’s IT manager(s). • A dashboard must remain simple and effective, proven practices of data modeling and visualization will ensure its relevance to user teams.
Data Maturity Path: Registrations for the May 4, 2023, webinar are open!
Our next webinar will be dedicated to the data dashboard, which can become a real decision support tool for employees and executives of a professional structure looking for answers. Click here to watch the webinar Step 2: From Spreadsheet to Dashboard.
Click here to access the previous article and webinar Step 1: Manual Data Processing.
Click here to access the next article and webinar Step 3: When Data Finally Tells Our Story.