Click here to watch the webinar Step 1: Manual Data Processing.
For many SMEs in French-speaking Switzerland, we are just at the beginning of the data maturity path. Yet, enlightened use of data in business is a real way to generate performance.
The past 10 years have seen the top 5 spots in the global market capitalization rankings – historically dominated by oil and gas companies – overtaken by the GAFAM (Google, Apple, Facebook, Amazon, Microsoft). The common denominator of these 5 champions: mastery of data and the path to maturity to achieve it.
While multinationals have adapted their strategic plans to allow for more digitization, small & medium-sized businesses are making slow but sure progress. Nevertheless, all professional organizations, both private and public, are concerned. Following a study conducted among 340 companies in France, the Observatory of Data Maturity of Companies (OMDE) identified these 3 main obstacles to data exploitation among the results published in November 2022:
- Lack of time (52% of respondents)
- Lack of internal knowledge/skills (46%)
- Lack of budget/financing (24%)
Let’s see how we can save you time with a strategic vision of data maturity in our upcoming series of articles and webinars.
Data Maturity in 5 Steps
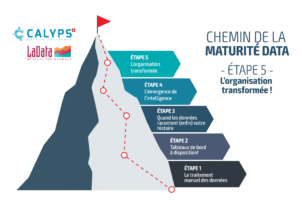
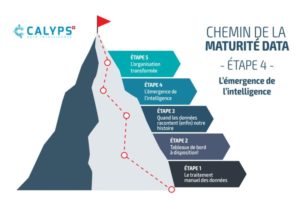
Our maturity model unfolds in 5 steps, from a basic level to complete data maturity:
- Manual Data Processing
- Dashboards Available
- When Data Finally Tells Our Story
- The Emergence of Intelligence
- The Transformed Organization
Let’s start at the beginning.
Step 1 – Manual Data Processing
At this stage, employees working in different departments of the same organization create one or several versions of a document each, most often in a spreadsheet. This manual approach lacks coherence and wastes time justifying how certain figures were calculated, instead of understanding what the data has to say.
Here’s a classic example: sales managers regularly express their frustration regarding manual data processing. Salespeople create their own spreadsheets to track client evolution and their commission, based on performance. In due time, these figures will also be shared with their team leader.
Team leaders, in turn, extract reports that the field team doesn’t have access to, to analyze their salespeople’s performance. They compile useful information, then prepare presentations which they send to their regional directors. The latter do exactly the same thing: they review the performance of their districts, manually generate a data set, visualizations, and then send everything to national managers. And so on… up to the top of the organization.
To summarize: • Manual reporting wastes time, efficiency, and carries a risk of human error. • A spreadsheet like Excel or Numbers does not manage governance or the distribution of information within user teams. • To advance on the path of data maturity, the misalignment on the sources of data used and their quality must be resolved.
Data, the Source of Truth
Does this business portrait sound familiar? Our next webinar is for you: data will be discussed as SPOT (Single Point of Truth) to be achieved on the path to maturity. Join us on Thu, March 16, between 11:30 AM and 12:00 PM with Théodmir Donnet, BI Consultant, and Martin Hannart, Senior Business Development Representative at Calyps. Click here to watch the webinar Step 1: Manual Data Processing.
Click here to access the next article Step 2: From Spreadsheet to Dashboard.


